Always Working for A Sustainable Tomorrow
Our Sustainability Ambitions
WM is reinventing what's possible to enable a more sustainable world. Leveraging our infrastructure, innovation, and expertise, we're centering our sustainability vision for the future around three core ambitions: material is repurposed, energy is renewable, and communities are thriving.
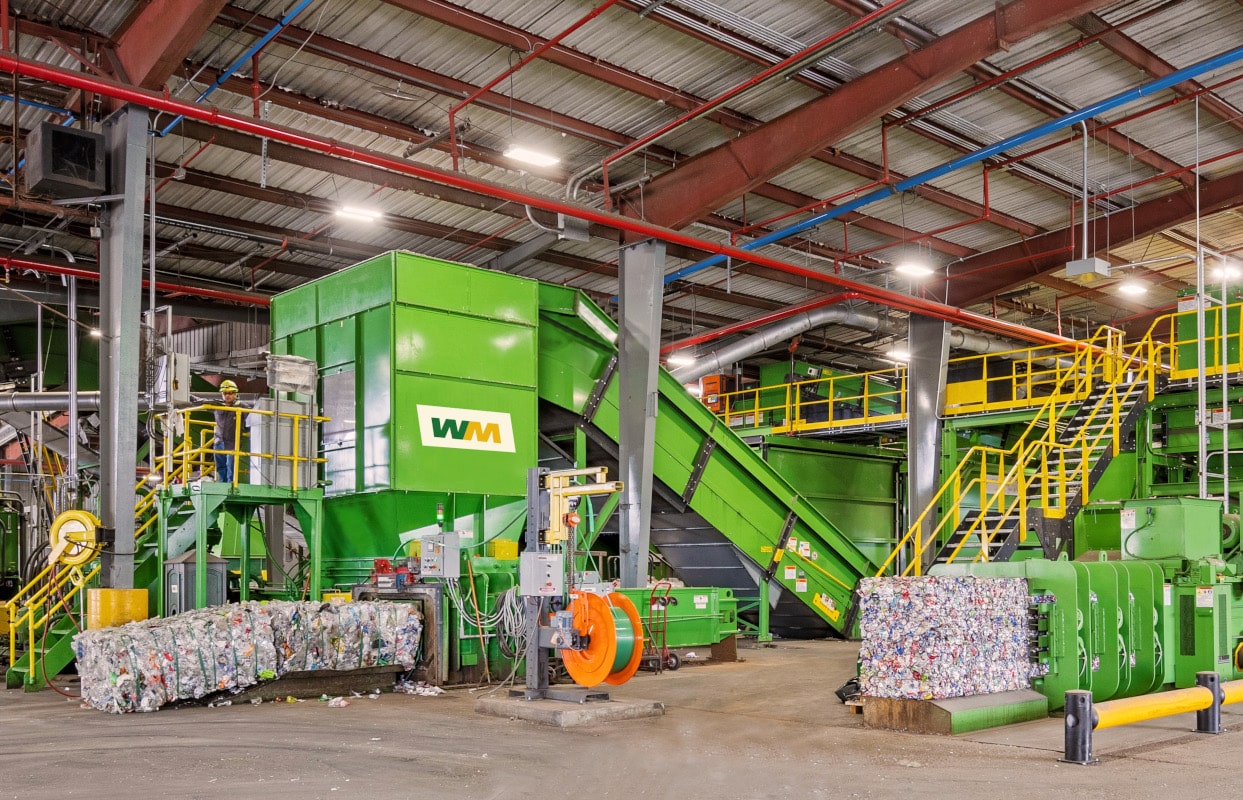
We operate innovative recycling and waste solutions that fuel the continuous reuse of materials.
2030 Goals
Increase recovery of materials by
60%
to 25 million tons¹
Interim milestone of a
25%
increase by 2025
¹ Target increase is from a base year of 2021.
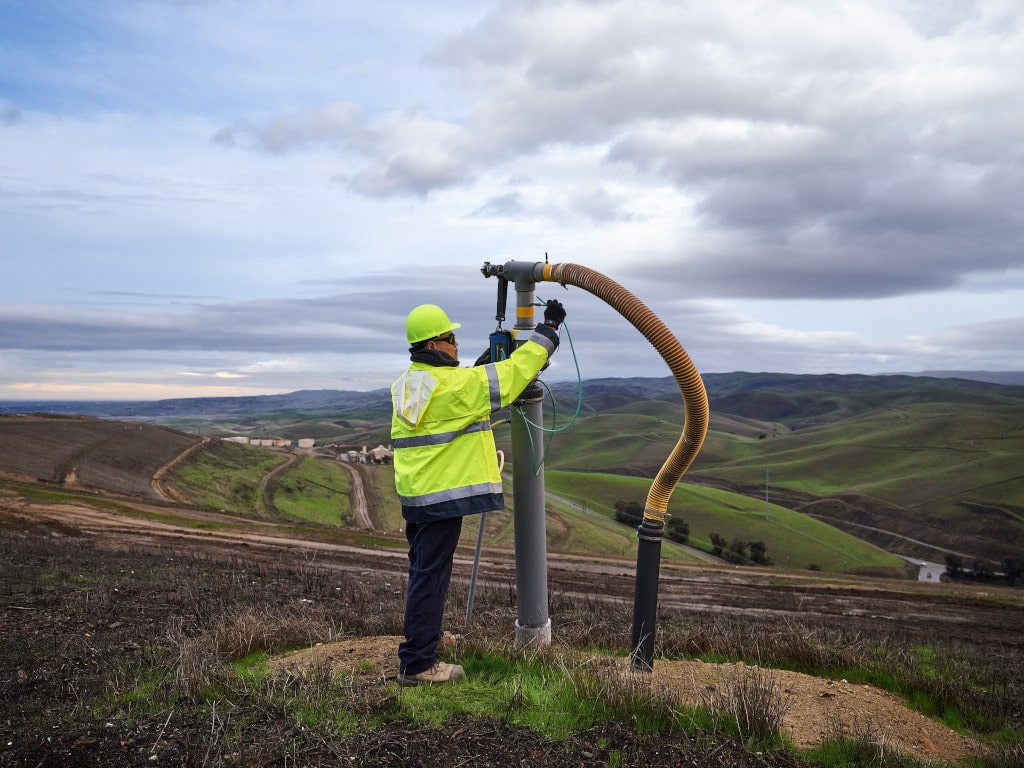
We leverage advanced technologies to turn waste into energy that powers communities and reduces emissions.
2030 Goals
Reduce absolute Scope 1 and 2 GHG emissions
42%
by 2031 (science-based target)²
Target beneficial use of
65%
of our captured landfill gas by 2026
² Target reduction is from a base year of 2021. The target boundary includes land-related emissions and removals from bioenergy feedstocks.
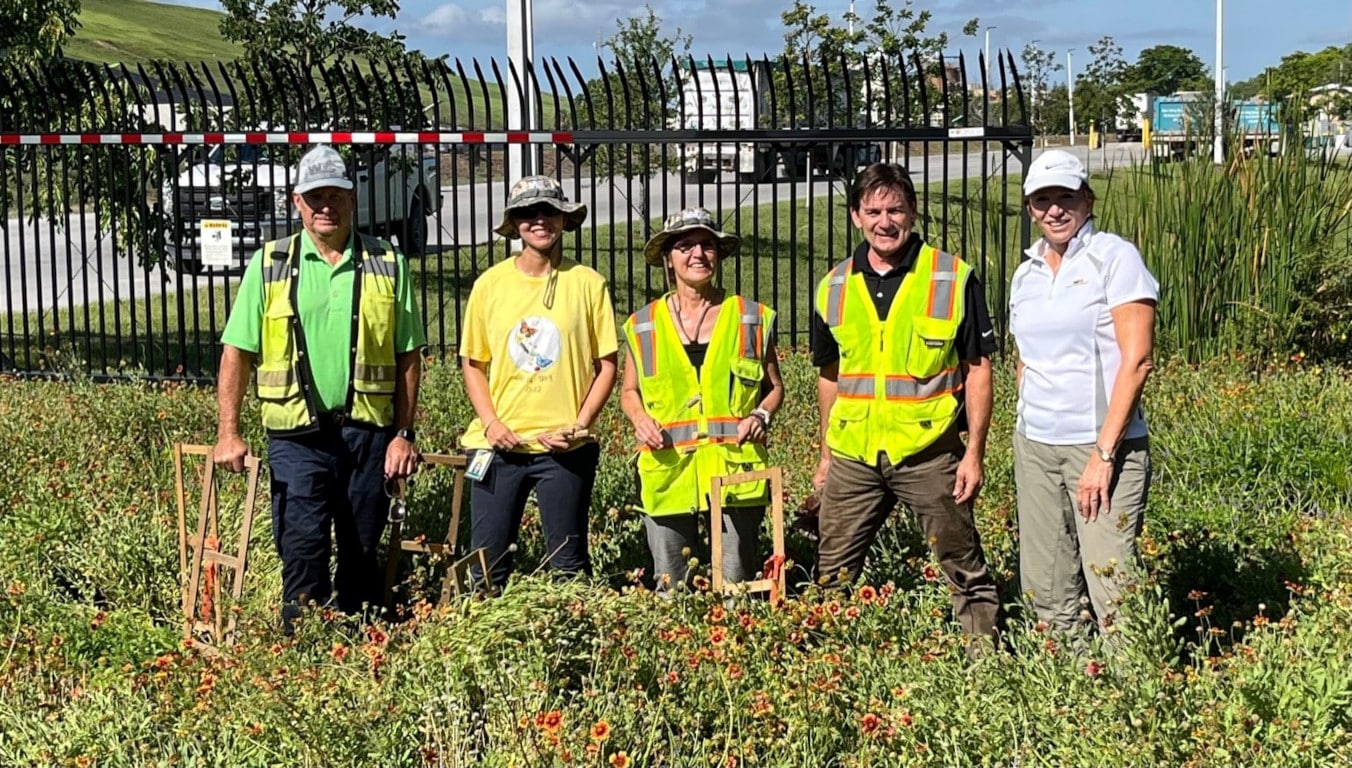
We collaborate to strengthen the resiliency of the diverse places where we live and work.
2030 Goals
Represent the communities we serve by increasing:
female representation
from front line to leadership roles
minority representation³
in manager and above roles
Reduce Total Recordable Incident Rate (TRIR) by
3%
annually targeting 2.0 by 2030; and continued focus on prevention of serious injuries
Positively impact through targeted social impact programming
10 million
people in our communities by 2030, using the equivalent of 2% of our net income
³ Minority representation references both racial and ethnic characteristics self-identified by team members.
Our Sustainability Ambitions in Action

Explore the topics below to learn about our work
10% reduction in direct greenhouse gas emissions
Scope 1 and 2 GHG emissions from a 2021 baseline
45% beneficial use of captured landfill gas
of renewable energy generated
$561 million
invested in growing recycling and renewable energy solutions
14.8 million tons
of material recovered
$15.9 million
in philanthropic contributions